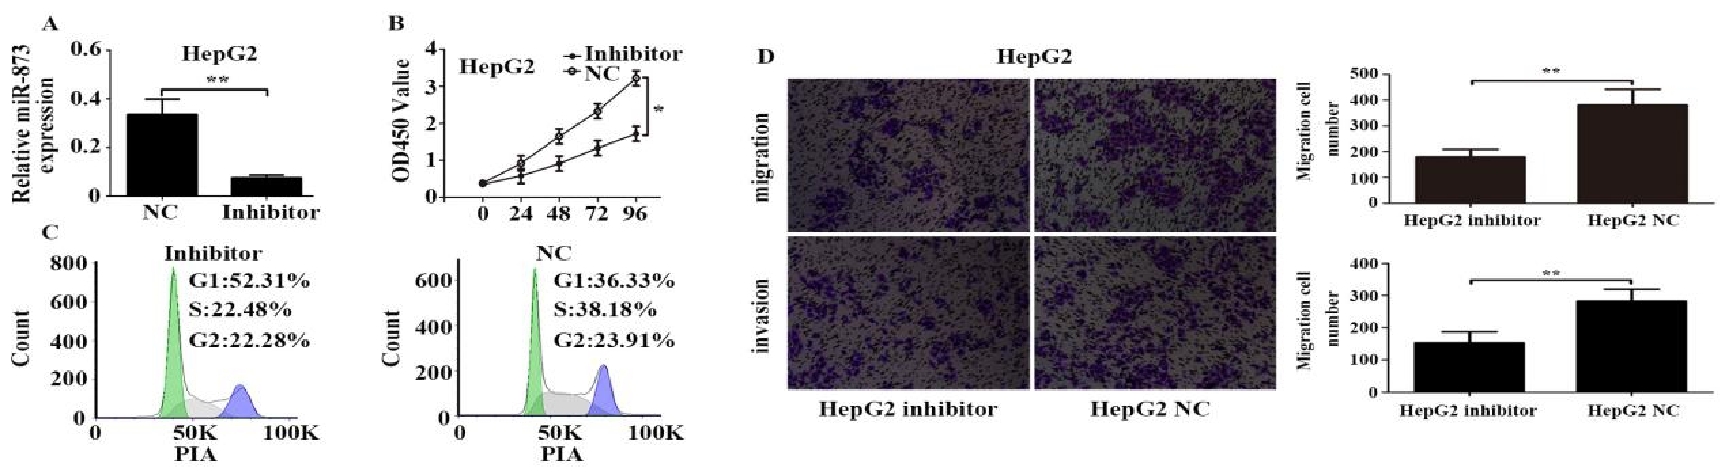
Fig. 2. The effects of miRNA-873 inhibition on cell growth, migration, and invasion by the HCC cell line HepG2. (A) Real-time PCR was used to measure miRNA-873 expression levels after transfection with an miRNA-873 inhibitor or negative control vector. (B) A CCK-8 assay was used to show the effect of miRNA-873 inhibition on the HepG2 cell proliferation rate. (C) Flow cytometry was used to show the effect of miRNA-873 inhibition on the HepG2 cell cycle. (D) Transwell assay was used to show the effect of miRNA-873 inhibition on HepG2 migration and invasion. *P<0.05, **P<0.01.